By Matt Bacon, Sept 14, 2020
Volatility returned to equity markets again last week as money fled big tech, which has led the rally almost exclusively since the March lows. This anxiety driver didn’t strike out of the blue; it has its origins in late August when we first started to witness a rotation out of Growth and into Value.
There are several factors that are contributing to the sell off. None of them have us particularly worried. The first is some simple profit taking from traders. Until late last week, FANMAG stocks (Facebook, Apple, Netflix, Microsoft, Amazon, Google) had significantly outperformed the S&P year to date. These six stocks are responsible for about 10% of this year’s return. The other 494 account for about -5%. Traders started to sell some of their positions in these stocks to lock in gains. Simple enough.
The Gamma Crash
A “Gamma Crash Up” was another contributing factor. This is more intricate. A month or so ago, an outrageously large buyer entered the options market and started making upside purchases on just a handful of big tech names. (The rumored buyer was Japan’s Softbank, and the buys totaled $ billions). This had to be hedged by the institutions that were on the other side of these options, as a win for Softbank would be a loss for them.
Enter Gamma. In finance this is the rate of change between an option’s price and the underlying security’s price. We’re going to skip the finer points on this, but the greater the Gamma the greater the risk. Billions were added to just the options and not the underlying securities, so options prices rose but the same didn’t happen to the underlying security. This led to large Gamma and institutions began purchasing the underlying securities to hedge their positions to reduce Gamma. The purchases in turn drove up the price on the underlying.
It’s a strange feedback loop. The higher the options prices spike, the more the underlying security has to be purchased, and the more the underlying security is purchased, the higher the options spike. This spilled over into the broader market and the result was a melt up that led to the best August in 30 years! Some of this looks like its starting to unwind and the market, which arguably rose too quickly in August on the back of Gamma hedging, is pulling back to a healthier level.
Election Jitters and Unemployment Figures
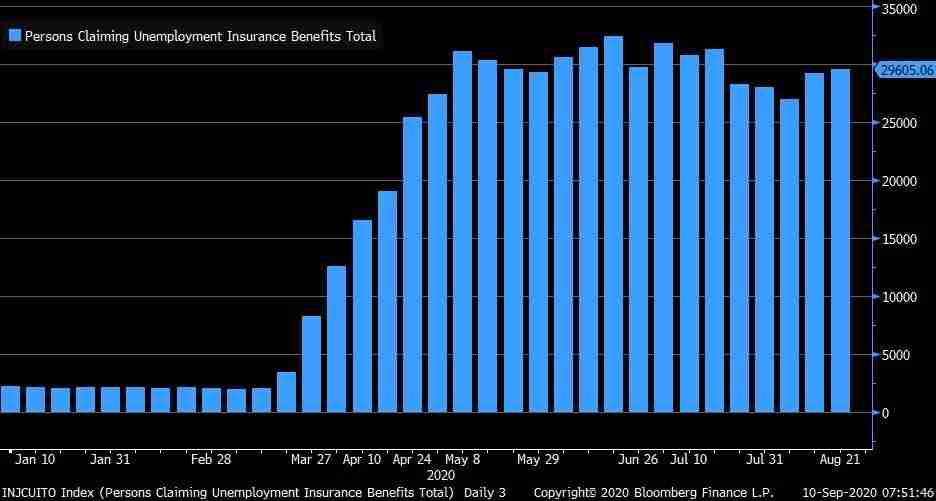
Now lets factor in some election volatility and economic uncertainty to all of this. The Federal unemployment insurance bump Congress enacted earlier this year ran out at the end of July. President Trump signed an executive order to provide an extra $300/week in unemployment benefits in August to help stem the tide, however only 30 states have currently signed on. The order requires many states to implement new protocols before they can distribute the funds, which means that many Americans still have yet to see the benefit matriculate into their accounts.
Despite best efforts, there is now less spending money in the pockets of consumers and less money flowing through the economy than in months prior. Somewhat unsurprisingly, we’ve seen jobless claims rise over the last few weeks.
Congress and the Senate are working to push another deal through but are at loggerheads. It’s unclear when, and if, a new round of stimulus will come through. This adds to the uncertainty of the underlying economic recovery, which is enough to create doubt that leads markets lower.
We’re now less than 60 days away from the presidential election. Historically, volatility has always spiked as we near an election. Both the NASDAQ 100 and S&P 500 volatility index’ have ticked up over the last month and are now tracking at over 30. This is high.
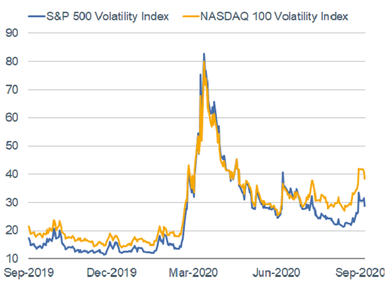
For perspective, when volatility in the S&P 500 hovers near 30 we typically see movement of about ±1.3%. Seeing daily swings like this can be difficult to stomach, but it’s exactly what we’ve witnessed over the last week or so. (Though swings in the NASDAQ VIX, which is above 40, have been even more extreme).

In all, the pullback is seeing the big tech names converge closer to their respective historical valuation average. The five largest stocks in the S&P 500 recently counted for a quarter of market cap. Its rare for 1% to count for 25%, but it isn’t unheard of. A highly concentrated index was also seen in the 40s, 60s, and late 90s – all with high levels of volatility.
A comparison to the dotcom crash isn’t warranted here, although its easy to see why pundits want to make it. The underlying fundamentals of the big tech names are a little high but otherwise reasonable (with the exception of Tesla, which we have written and warned about prolifically). Here’s where things stand as of market close on Sept 10th, 2020:
Price to Earnings (P/E) Ratios
Facebook – 34x
Apple – 34x
Netflix – 82x
Microsoft – 36x
Amazon – 121x
Google – 35x
We see two possible paths going forward. The first sees the broad rotation out of growth and into value continue while the market largely stays flat. Money keeps flowing from technology/deflationary assets into old economy/inflationary assets (smokestacks). Sell Apple and buy Honeywell, for example.
The second sees the market enter a correction phase but with assets still rotating out of growth and into value. The value assets decline by less than the growth assets, making it the relative winner and the prettiest pig in the pen. This would be similar to the dotcom crash we saw in the late 90s/early 00s.
In the latter, the correction would likely be short and shallow. Valuations aren’t anywhere close to where they were in the dotcom era, leaving less room for a downward spiral. Moreover, there is an unprecedented amount of cash on the sidelines and an extremely accommodative Fed; two critical correction-busing ingredients that weren’t readily available at the start of the dotcom crash.
Whatever happens, we believe the next phase will see value outperform growth. There’s just so much more room for it to run.
As we slowly watch these trends play out, we’re cognizant that the arc of history is long. Markets are usually jittery in September and October. The last two times August finished up more than 5% the following month was down 5.4% (2000) and 8.5% (1986).
Be calm. Be patient. Stay safe. This, too, shall pass.