Who will go first, you or your money? You’ve doubtless had a nightmarish fever dream playing this out if you’re approaching retirement. Countless articles address it, an industry has developed to solve it (mine), and your friends, family, and neighbors all have their say about it too. But the science behind how to solve this problem isn’t clear cut.
Confidence intervals are the closest thing you’ll get to an answer. And that’s because retirement success can’t be guaranteed. There are just too many variables to be forecasted decades into the future when determining, in today’s dollars, how much is enough. Everybody has to roll the dice to one degree or another.
So how can you determine your likelihood of retirement success? It starts with the basics.
The Role of Guaranteed Income Sources
Its simple enough. Don’t spend more than the guaranteed checks you get each month and you won’t run out of money. Guaranteed income sources include social security, pensions, and any income you receive from annuities.
DISCLAIMER: rental income might be consistent but it isn’t guaranteed. Don’t lump it in here.
Social Security
Consider your Social Security first and foremost. You can claim your full benefit at your full retirement age, which is usually somewhere between 66 and 67 for most people. Your birthdate determines where you fall. The amount you receive increases if you defer taking it past your full retirement age and dips if you take it sooner.
It’s a complicated system and there are many nuances that can impact your benefits. Your marital status, spouse’s earnings, whether you’re a widow(er), whether you have dependent children, and whether you have a government pension will all impact your payout. But whatever monthly check you do end up receiving will form part of the bedrock of your retirement income.
Can I count on Social Security
The short answer is yes. Social Security won’t disappear and its not wise to completely disregard it in your retirement planning. The system is pay as you go, meaning that all the revenue collected in month one is paid out in month two. There will be money coming in so long as there is a generation of American’s that head into work every morning.
The rub is that the current system is underfunded. The 2021 Social Security Trustees report finds that recipients will take a roughly 22% pay cut in 2034 if Congress doesn’t act to fix it. And while not a great long-term solution, the government can print money to plug a shortfall (though the easiest fix would arguably be to raise taxes or increase the taxable wage base).
Its for these reasons that we include Social Security in the retirement projections produced for our clients. You should include it in your own projections, too.
Pensions and Annuities
Beyond this lies pension income streams and annuities. These are safe and boring monthly payouts similar to Social Security but provided by either a former employer or an insurance company. These are generally reliable but not to the same degree as Social Security.
Annuities are backed by insurance companies. Most tend to succumb to consolidation as opposed to insolvency when times get tough, but some do go out of business. Each state has their own system in place to make good on the promises of defunct insurers when this happens. Maryland has their own Life and Health Guarantee Corporation, for example, which insurers up to $250,000 of the present value of annuity benefits.
Pensions are guaranteed by former employers. These can be quite stable when the employer is a governmental entity with the power to levy taxes. It can be less stable when guaranteed by a former employer. The Pension Benefit Guarantee Corporation does exist to help provide for pensioners when pension funds run dry, but benefit reductions are possible.
Will it go to $0?

It’s possible but unlikely. We generally include the full pension and annuity amount when running retirement projections in this office. Many corporate pensions have already undergone painful restructurings to make them solvent, and newer retirement plans are rarely as benefit rich as older ones. Both of these factors make it more likely that the payout you’re expected to receive is more reliable.
Why the guarantee matters
Retirement planning comes down to confidence intervals. Are you 60% sure you’ll have enough money to last or are you 90% sure? Guaranteed income sources go straight to your bottom line and improve your chances more than any other variable in your planning, apart from how much you’re spending.
Every dollar generated from a guaranteed source is a dollar that doesn’t have to come from a non-guaranteed source, such as investments in the stock market. If these income streams cover all of your bills, great! Your single-largest risk factors are inflation and changes to your expenses, only one of which is in your control.
This means you’ll also need some money from non-guaranteed sources. New risks to your retirement crop up when you do this. But that doesn’t necessarily mean your retirement becomes less secure. Its about how you manage these risks that determines whether your likelihood of not running out of money improves.
The 4% Rule and how it works
Add up every liquid, spendable account you have. Bank accounts, 401ks, IRAs, brokerage accounts – whatever. Add it all up to arrive a single grand sum. This is the total from which you can withdrawal an inflation-adjusted 4% every year for living expenses. This is the 4% rule that forms the basis of so much in retirement planning.
For example, if you have $1,000,000 saved then you can withdraw about $40,000, or 4%, the first year of your retirement. If inflation is 2% the following year you would give yourself a 2% raise and take out $40,800. It’s pretty straightforward.
The odds of your portfolio making it for at least 30 years is high if you follow the 4% rule. In fact, its almost 100%. This was the finding in the original study as well as others that have since confirmed it. It sounds incredible, but it’s not without limitations.
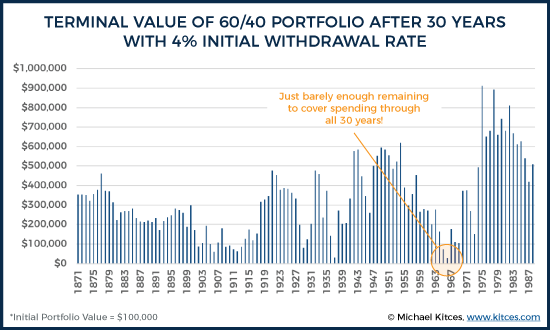
Going Beyond 4%
Here’s the most obvious question – what if you need more than 4%??? The initial literature is a little bleak here, but the short answer is that your portfolio survival rate starts to drop. That’s not necessarily the end of the world. Moving from a 100% confidence interval to a 90% or 95% interval may not be a big deal for you.
There are some other shortfalls to using the 4% rule as well. All research supporting it was done using back tested portfolios. If you haven’t heard it by now you can hear it today: past performance is not an indicator of future results. Market returns over the next thirty years could be nothing like the past thirty years and the research underpinning the 4% rule could be bunk.
The research was also based on a moderate portfolio with something between 50% and 60% in equities depending on the study. Your own portfolio composition may vary over time and that level of equities may not fit with your risk tolerance. But perhaps the biggest drawback is the fact that this research doesn’t account for taxes or fees, nor is it clear what outsized 9%+ inflation does to that safe 4% withdrawal rate over time.
No planner has a bonified answer for how to address the myriad of shortfalls to the 4% rule. Some have suggested a retirement “guardrails” approach that focuses on cutting income streams during bad years where market returns or inflation is dismal. I have yet to meet the retiree that is content to take a pay cut during their golden years. Some retirees may be on the margin and won’t have the capacity to cut expenses in the first place. Others may have unexpected expenses that prevent them from scaling back at the opportune time.
In short: there is no silver bullet. Nobody has this problem licked. The closest the field has come is the flawed 4% rule. And that takes us back to confidence intervals. How sure can we get to knowing what we can’t possibly know?
Filling in the Gaps
You will need to pin down a few different variables before you’re able to calculate the likelihood of outliving your assets:
- Your living expenses. This includes travel, healthcare, insurance, utilities, groceries and everything else you need to live. How much money will leave your account(s) every year?
- Time horizon. Is it age 90? 95? 105?
- When would you ideally like to become financially independent (earliest possible retirement date)?
- How much guaranteed income will you have during your retirement?
- What’s the average inflation rate you expect to see during your retirement?
- What’s a realistic rate of return assumption for your portfolio?
- How will you cover a major medical bill or long-term care event late in life?
Its pays to be realistic with your assumptions. Don’t plan on a retirement ending at 75 If you’re in great health and your family members routinely live into their late 90s.
Is it realistic to fully retire at 50 while your kids are still in college? Or would a less stressful job accomplish the same thing for your mental health? Are double digit investment returns realistic as you forecast out over the next three decades? Be honest and conservative with your assumptions. Anything less and you risk jeopardizing your retirement success.
A quick case study
Here’s an example of what we commonly see in our office:
- $10,000/month living expenses, of which $3,000 is a mortgage payment that disappears in seven years.
- Time horizon to age 95
- Husband is 61 and wife is 58
- $4,500/month combined Social Security at full retirement age (67)
- 3% inflation and 5% assumed rate of return on investments
- $1,500,000 total liquid net worth spread across multiple investment accounts
You can take a quick look at this fact pattern and see that the couple is in decent shape to retire at their full Social Security retirement age. Their mortgage should be just about paid off and they’ll have another 6-9 years of savings and investment growth on a $1.5M pile of money, which can already generate a little over half of their monthly needs using the 4% rule. It’s not a question of whether they are in good shape to retire; they are. Its an issue of how soon.
Stats, but dressed up to sound cool
You can do some simple linear modeling in Excel to calculate out the earliest retirement date with the information above. Plenty of calculators are available to help you map it out.
But this doesn’t address things like the actual, variable rate of return you’ll get or whether you can survive a bear market early in retirement. Nor can it plan well for an unexpected expense at an inopportune time.
You need to do some statistical modeling to factor in the likelihood of surviving those kinds of unknowns. Maybe you or the hypothetical couple from above is ok to retire at 61. But would you work for an extra year if you could reduce the likelihood of outliving your money from 20% to 15%? What would you be willing to change to get that likelihood down to no more than 5%?
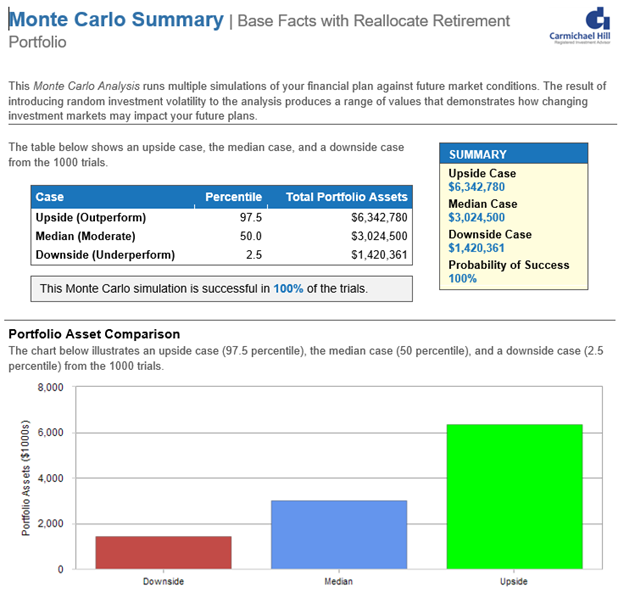
Monte Carlo simulations are used to figure this out. Our office uses fancy software to calculate this on behalf of our clients, but you can build out your own Monte Carlo model in Excel with some moderate/advanced modeling skills. These simulations randomize variable(s) in your plan, such as the rate of return you receive on your investment accounts, over hundreds if not thousands of iterations. We can get a reasonable feel for how well you’re expected to do based on the number of iterations where you didn’t run out of money!
For example, maybe the hypothetical couple runs out of money in 300/1000 iterations where they retire into a bear market at 61. But this figure drops to 100/1000 when they retire at 64. We’d say their success rate goes from 70% to 90% if they’re willing to work an extra three years.
Again, its not about whether you can retire. Its about how likely you are to stay retired. Determine what retirement confidence interval you’re comfortable with and then adjust the inputs you can control to find the right mix for you. (It really does all boil down to saving more, working longer, or spending less at the end of the day!)
Backing into a savings rate
Time to check in; by now you should have a general idea of how much you need to have saved to make retirement work at your preferred confidence level.
- Expenses – Guaranteed Income Sources = Annual shortfall that must be covered by savings
- Annual shortfall ÷ 4% = Total liquid net worth needed to fund retirement
So how much do you need to save each year to accumulate a liquid net worth approaching that level? There are plenty of calculators to help you determine this, but you can also build this into Excel or by using a financial calculator with the following inputs:
- Present Value (PV) – how much you have saved today
- Interest/Rate of Return (i) – interest, or rate of return in this case
- Years (n) – the number of years between now and when you plan to retire
- Future Value (FV) – the ending amount you need to have saved by the time you retire
- Payment (pmt) – ???
Payment is what you’re solving for given the other inputs. This is the amount you will need to “pay” to a savings account to make everything work.
All the Other Stuff
Everyone has a different outlook. You may be dependent on your home equity to fund your retirement or relying almost entirely on cash flow generated from rental properties. You could hold significant stock options with significant risk, or have a deferred compensation plan you believe may go belly up. Maybe your plan involves working part time or supporting a child with special needs. There isn’t a “right” or correct way to do retirement and there isn’t a one size fits all solution.
What’s important is that you establish a baseline to build from. We’ve outlined the essential working mechanics for this from which you can build any number of additional what-if scenarios. But if you’re unsure about it or want someone to check your work, then go find a planner! We can help you do this as can many other fee-only, fiduciary planners.
The Bottom Line
You cannot guarantee your retirement any more than you can guarantee living to 100. Planning well for it is about being comfortable with the unknowns as much as anyone can be and taking the right steps to hedge your risks. Determine your confidence interval and plan accordingly by saving more, spending less, or working longer. For all the noise out there about retirement planning and all the products companies may scare you into buying, it really is about those three things: save more, spend less, or work longer to plug a shortfall. Everything else is gravy.