James Stewart December 2, 2020
November was the best month in decades for equity markets. The Dow Jones Industrial Average posted its best monthly return since 1987. The Dow closed over 30,000 for the 1st time during the month before profit taking set in. Stocks from companies of all sizes rose with the small cap Russell 2000 Index posting its best monthly gain ever of 18.3%. With the Presidential election behind us and positive vaccine news the market screamed higher.
So where does the market go from here? Something unique is occurring and it’s a little difficult to process. Both market sentiment, a measure of investor perception about markets, and market breadth, which measures the number of individual stocks rising or falling, are at highs. This usually doesn’t occur at the same time. Let’s breakdown the market sentiment first. Speculative stocks and sentiment figures are near peak levels.
Example 1: CNN Fear Greed index
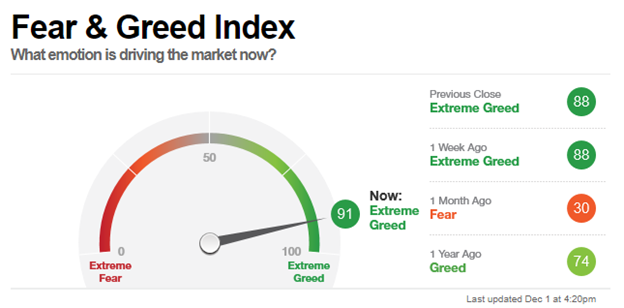
Notice the low level of just a month ago (30)? That was pre-election when Wal-Mart removed guns from their stores as predictions of riots and civil war were in the headlines.
Example 2: Grayscale -Litecoin Trust (LTCN)
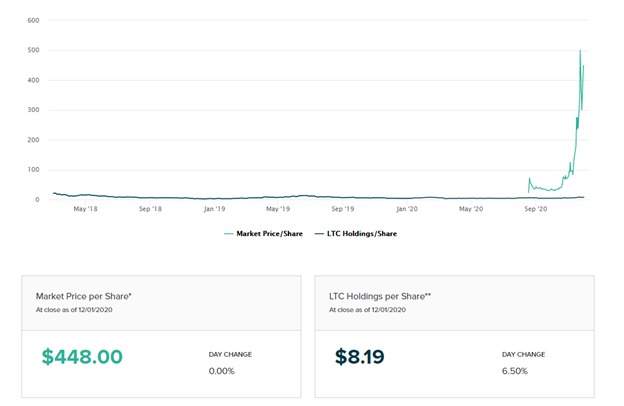
The value of the fund is $448/share as of closing on 12/1/20. The underlying investments in the fund are valued at $8.19/share. Investors are buying a fund at a premium or price that is 55 times the value of the investments in the fund. If the fund were liquidated today and money returned to the shareholders, each shareholder would receive $8.19 a share. This is crazy! It shows just how much speculation there is in some areas of the crypto currency market.
Example 3: Ned Davis Research Sentiment Poll
Sentiment is a contrarian indicator. When everyone is optimistic/bullish we usually get a market pullback. When everyone is pessimistic/bearish the markets usually rebound. As you can see in a truly short period of time the sentiment has shifted from pessimistic to optimistic.
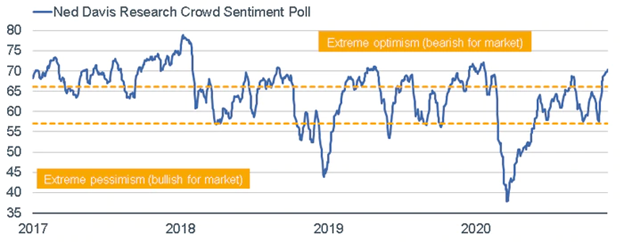
Source: Charles Schwab, ©Copyright 2020 Ned Davis Research, Inc.
Historically, sentiment alone is not a great timing tool. The markets can and do have extreme readings for weeks/months before correcting. Extreme readings usually occur several times a year.
What is unusual about this time is that the market breadth readings are also at peak levels. See the below chart:
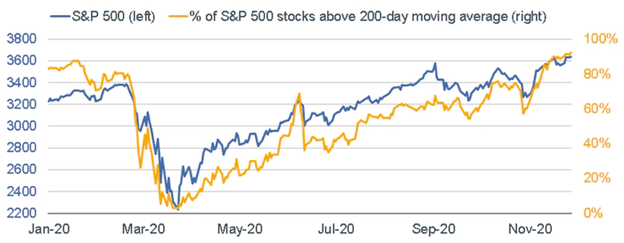
Source: Charles Schwab, Bloomberg, as of 11/27/2020. For illustration purposes only. Past performance does not guarantee future results.
More than 80% of stocks are above their 200-day moving average in price. This is very bullish for the longer term and could be signaling the start of a new bull market. Usually substantial market drawdowns occur when market breadth is declining (see the February timeframe) as opposed to rising. Add to the fact that other major indices – the Russell 2000 and MSCI All Country World Index – are displaying the same characteristics and a global recovery looks like its underway. Hence the reason for confusion in these unique times.
Where do we go from here?
It’s hard to say with any degree of confidence in the short term. I believe the market’s advance in the most speculative sectors will pause/consolidate. Funds will then rotate to other sectors while the overall markets grind higher into year end. After the New Year, we could see the broader markets pause depending on the outcome of the GA Senate race, additional fiscal stimulus, and “the plan” for vaccine distribution.
Volatility will probably remain elevated as we navigate these crosscurrents. With the pandemic and the historic amount of capital needed to prevent an outright economic depression, the metrics and tools used to determine market conditions may need to be reevaluated. We may have to see ferocious and extreme sentiment/valuation levels before they provide any useful insight. (The last time we saw something like this was Y2K and the corresponding tech bubble). We are in uncharted territory here despite having the best November in decades, which is so 2020!!!